An accounting KPI dashboard is a live financial control system that shows the numbers that actually drive your business. If you want faster decisions, tighter cash control, and fewer surprises, an accounting KPI dashboard gives you one connected view of performance, risk, and operational reality.
What an Accounting KPI Dashboard Does for Your Business
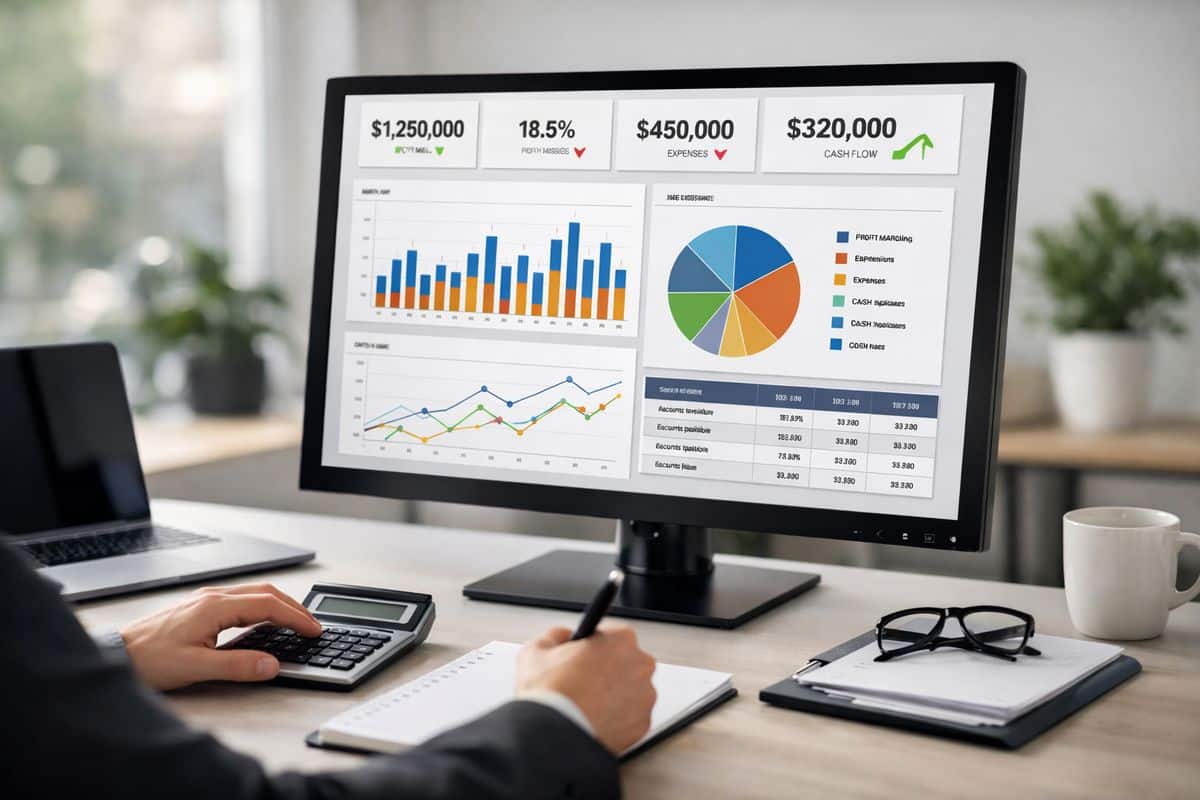
A dashboard is not just a prettier report. It is the screen you use to monitor business health in motion. Instead of waiting for month-end packs, scanning spreadsheets, and stitching together finance updates from different systems, you see the position now: margin, cash, collections, liabilities, close performance, and variances against plan.
That distinction matters. A report usually tells you what happened. A metric is a number. A KPI is a number tied to a business outcome that matters. The dashboard brings those KPIs into one decision-ready view, so you can act before a problem turns into a funding gap, margin leak, or missed target.
The strongest dashboards also connect finance with operations. Revenue trends mean more when you can see billing speed behind them. Cash pressure means more when you can trace it to overdue receivables, stock build-up, or rising supplier spend. That is why a proper dashboard works as a control system, not a finance ornament.
KPI vs metric: what you actually need to track
Every KPI is a metric, but not every metric deserves dashboard space. A KPI tracks a strategic outcome. A metric supports day-to-day monitoring. That distinction is simple, but it changes everything.
If your dashboard tries to display every figure available in your accounting system, it stops being useful. You do not need noise. You need the handful of numbers that show if your business is profitable, liquid, efficient, and under control. Matching KPIs to your goals is what separates a working dashboard from a cluttered screen no one trusts.
The Core KPIs That Belong on an Accounting Dashboard
Most strong accounting dashboards follow the same logic. They track profitability, liquidity, efficiency, cash flow, growth, and control. Those categories give you a balanced view of what is happening across the business instead of over-focusing on revenue or bank balance alone.
Research consistently groups financial KPIs into broad areas such as profitability, liquidity and efficiency, and that structure holds up in practice. For an owner, CFO, or financial controller, the goal is clear: track the indicators that show whether revenue is turning into profit, whether cash is moving fast enough, and whether your finance process is producing reliable numbers.
Profitability KPIs: see whether growth is delivering margin
Revenue growth without margin discipline is a trap. Your profitability KPIs show whether sales are creating value or just creating workload.
Gross profit margin tells you how much revenue remains after direct costs. The formula is simple: net sales minus cost of goods sold, divided by net sales. If this margin starts shrinking, pricing, supplier terms, product mix, or delivery costs need attention. Net profit margin goes further and shows what is left after all expenses. Operating margin, often measured as return on sales, shows how efficiently your core business converts sales into operating profit.
Budget variance belongs here as well. It tells you whether performance is landing where you planned, not just whether it looks acceptable in isolation. A business hitting revenue targets while missing margin targets is not on plan. It is underperforming.
Liquidity and cash flow KPIs: protect working capital
Profit does not pay wages. Cash does.
Your liquidity view should include operating cash flow, cash flow run rate, current ratio, quick ratio, and cash conversion cycle. These KPIs show whether your business can fund itself, absorb shocks, and make short-term decisions with confidence. If you want a deeper sense of why this matters operationally, seeing cash clearly across the business changes the quality of every finance decision.
Operating cash flow shows whether trading activity is generating cash. Cash flow run rate shows how long current cash generation can support the business at the present pace. Current ratio and quick ratio test short-term financial strength. A current ratio below 1 is a warning sign, and many businesses aim for a quick ratio above 1 to maintain real flexibility.
Then there is the cash conversion cycle. This tells you how long cash is tied up between paying suppliers and collecting from customers. The shorter the cycle, the less strain on working capital.
Working capital efficiency KPIs: speed up cash movement
Working capital is where financial control becomes operational. Slow invoicing, weak collections, or poorly timed supplier payments all show up here.
Days sales outstanding, or DSO, measures how quickly you collect receivables. Days payable outstanding, or DPO, shows how long you take to pay suppliers. Accounts receivable turnover and accounts payable turnover reveal the same pattern from a different angle: how efficiently cash moves through billing and payables processes.
These are not back-office vanity measures. They tell you whether your systems, policies, and team behaviour are helping or hurting liquidity. A low DSO strengthens cash flow. A controlled DPO preserves cash without damaging supplier relationships. Friction in either area usually points to broken workflows, inconsistent invoicing, approval delays, or poor follow-up.
Close, control, and finance team performance KPIs
A dashboard should also show whether your finance function is producing numbers you can trust.
Time to close the books is one of the clearest indicators. If the close drags, decisions drag with it. Invoice processing time and cost to process an invoice reveal how efficient your accounts payable operation is. Percentage of manual journal entries is another useful signal. The higher it is, the more your reporting depends on human workarounds instead of controlled processes.
General ledger accuracy, financial report accuracy, and audit readiness round out the control layer. These KPIs matter because confidence in the dashboard depends on confidence in the source data. If your finance process is slow, manual, or inconsistent, every headline KPI is weaker than it looks.
How to Choose the Right KPIs for Your Dashboard
The best dashboard is shaped by how your business actually works. Copying a generic KPI list from a software template usually produces a dashboard that looks impressive and answers very little.
A service business needs strong visibility into utilisation, margin, payroll intensity, and receivables. A product-led business needs tighter control over gross margin, stock movement, and fulfilment costs. A multi-entity group needs consolidated visibility with the ability to drill into entity-level performance. A business with complex billing needs to track contract timing, invoicing discipline, and revenue leakage.
Match KPI selection to your business model and growth goals
Universal dashboards fail because businesses do not generate cash and margin in the same way. If your cost base is labour-heavy, workforce efficiency matters more. If stock ties up cash, inventory-linked indicators belong on the screen. If you operate across entities or jurisdictions, control and consistency become a bigger priority.
That is also why modern finance teams move beyond static reporting and towards live accounting rather than month-end lag. Your dashboard should reflect the operating model behind the numbers, not just the ledger structure.
Use targets, trends, and benchmarks instead of isolated numbers
A standalone number tells you almost nothing. A gross margin of 32 percent is meaningless unless you can compare it with budget, prior month, prior year, and your acceptable threshold.
This is where dashboards become powerful. Trend lines show direction. Budget comparisons show execution. Benchmarks show competitive position. Threshold alerts show urgency. According to NetSuite, trend analysis over time is far more useful than single-point snapshots, and that is exactly right. Passive reporting describes the past. Active control shows movement and flags action.
What a Good Accounting KPI Dashboard Should Include
Useful dashboards share the same core traits: live data, clean visual logic, drill-down capability, and integrated reporting. If any of those is missing, control weakens quickly.
The dashboard should give you a fast summary first, then let you move into the detail behind a number without leaving the system. If cash is down, you should be able to trace whether the issue sits in receivables, creditor timing, payroll pressure, or margin erosion. If budget variance is off, you should be able to see where and why.
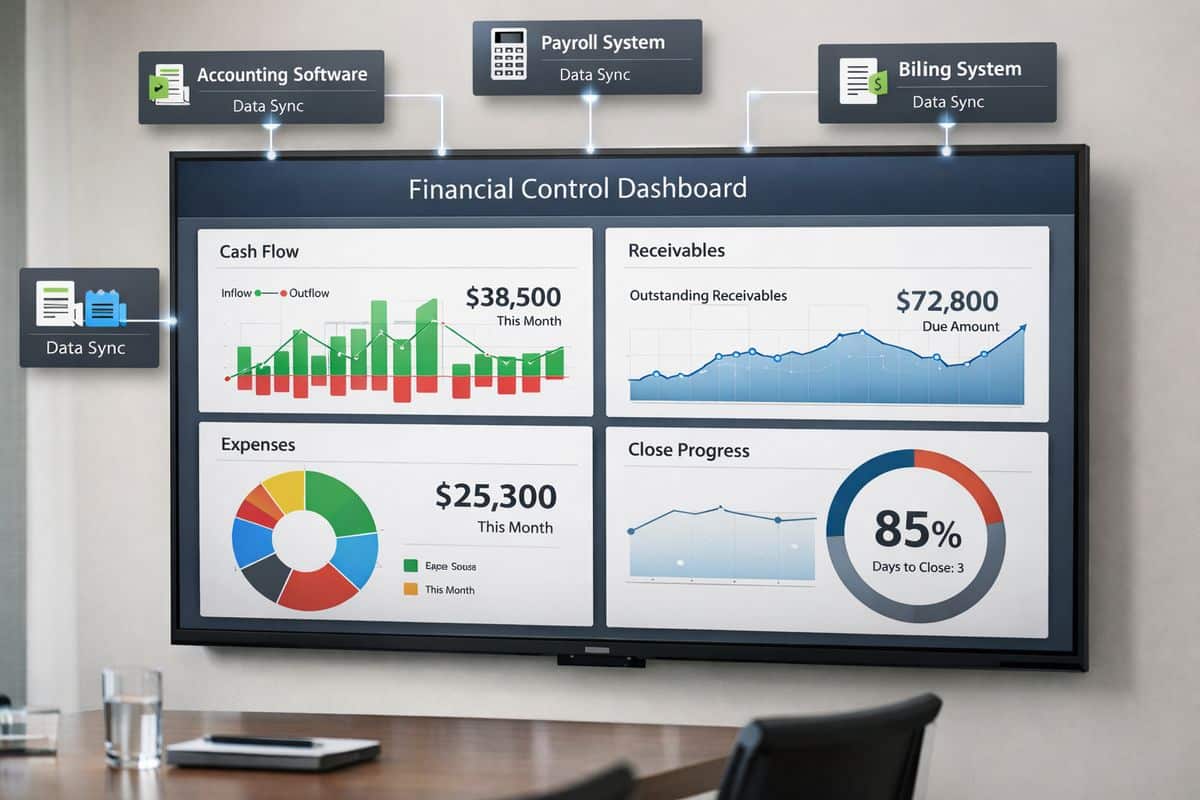
One connected data source across accounting, operations, and reporting
Disconnected systems create duplicate work and conflicting answers. One report says margin is healthy, another says spend is climbing, and nobody is sure which number is current.
A good dashboard fixes that by connecting accounting software, ERP, billing, payroll, and operational platforms into one reporting structure. That is how Prodyssey Solutions approaches finance visibility: connect the systems, automate the flow, and make the numbers usable. When finance and operations sit in one data model, your dashboard reflects the real business rather than fragments of it.
Real-time updates and automated calculations
If your KPIs update once a month, you are steering with a delayed map. Daily or live updates matter most around cash, receivables, spend, and forecast movement. That is where fast intervention protects margin and liquidity.
Automation matters just as much. Manual spreadsheet reporting introduces delay, inconsistency, and version-control problems. By contrast, real-time integrated updates keep calculations consistent and reduce reporting friction. The practical upside is obvious, and the operational gains from automating repetitive finance tasks compound quickly.
Clear views for owners, CFOs, and financial controllers
Not every user needs the same dashboard view. You need different screens for different decisions, but all from the same source data.
An owner needs quick visibility into cash, margin, growth, and major risks. A CFO needs strategic and forecasting views, plus the ability to compare business units and track trend movement. A financial controller needs close speed, process efficiency, control measures, and data quality indicators. One data foundation, different lenses. That is how dashboards stay relevant without becoming crowded.
Common Dashboard Mistakes That Weaken Financial Control
Bad dashboards usually fail for predictable reasons. The problem is rarely lack of data. The problem is poor selection, weak inputs, and delayed reporting logic.
Tracking too many KPIs at once
More numbers do not create more control. They create hesitation.
An overloaded dashboard forces you to scan, sort, and interpret too much at once. That slows decisions and hides the indicators that actually need intervention. Your dashboard should focus on the few business-critical KPIs linked directly to outcomes such as cash flow, profitability, efficiency, and control.
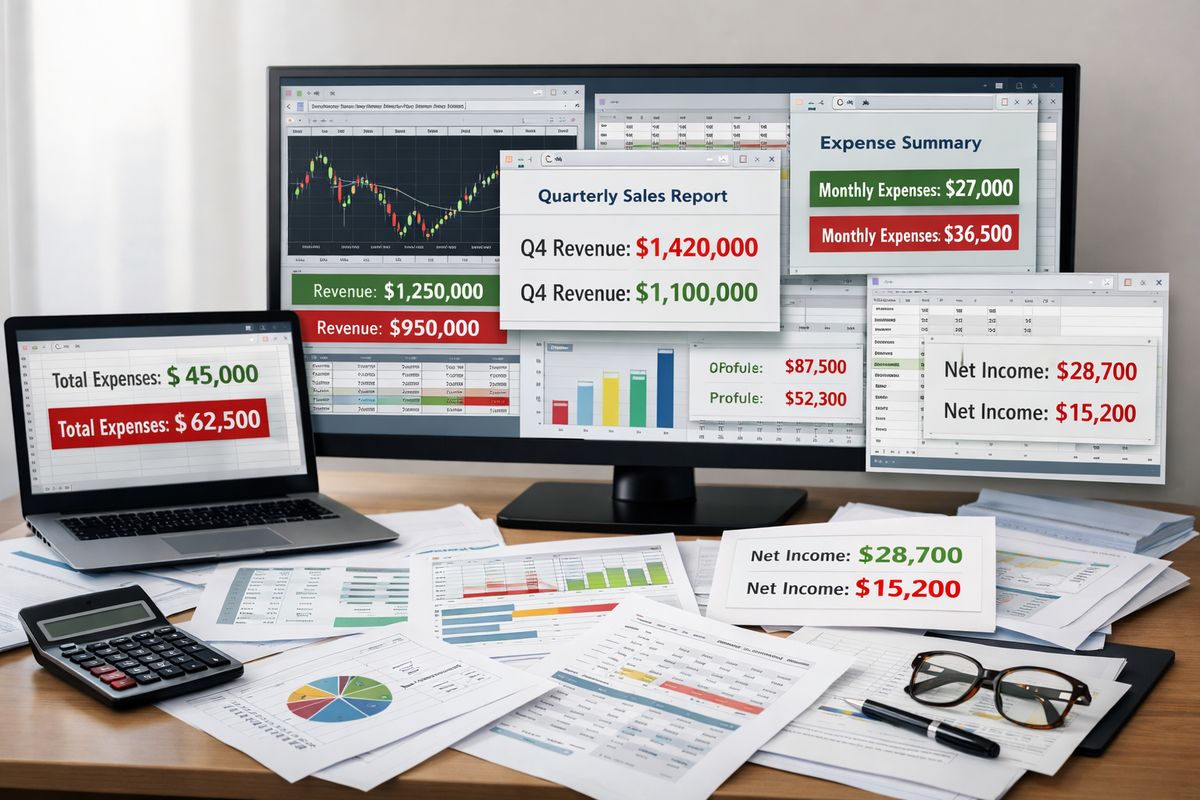
Relying on manual spreadsheets and inconsistent inputs
Manual reporting breaks at scale. Errors creep in, versions conflict, and updates arrive too late to influence decisions. Once that happens, confidence drops fast.
If you are still building dashboards around spreadsheet exports and hand-built formulas, the reporting process itself becomes a risk. Clean data and repeatable automation are not nice extras. They are the foundation of every KPI you display.
Measuring historical performance without forward visibility
Historical reporting has value, but it is not enough. Looking only at what already happened leaves you reactive.
Your dashboard should include forward-looking indicators such as cash runway, budget variance trends, receivables ageing movement, and operational early warnings. That is the difference between reporting history and managing performance. If your current process is still built around delayed close cycles, why month-end slows decisions becomes painfully obvious once you see what live visibility can do.
How to Build an Accounting KPI Dashboard That Drives Better Decisions
A strong dashboard starts with business priorities, not software. Define what you need to control, choose the KPI categories that reflect that, lock the formulas, confirm the data sources, automate the flows, assign ownership, set targets, and review the dashboard regularly.
A practical rollout plan
Start with the decisions that matter most: cash protection, margin control, faster close, better forecasting, tighter receivables, stronger board reporting. Then choose the KPI set that supports those decisions. Keep it lean. Confirm formulas early so nobody debates definitions later. Connect the systems. Automate the data movement. Assign an owner to each KPI. Review the dashboard on a fixed rhythm and replace indicators that no longer drive action.
When to involve an external accounting and technology partner
External support adds immediate value when your systems are fragmented, your reporting is manual, your group structure is complex, or your finance team is spending too much time assembling numbers instead of using them. That is especially true when you need board-ready reporting, multi-entity visibility, or a finance function that works as an operational partner rather than a historical reporting team.
Once you understand what an accounting KPI dashboard is supposed to do, the standard becomes obvious. It should not just tell you what happened. It should show you what needs attention now, why it is happening, and where to act next. That is when finance stops being a record of the business and starts becoming a control system for it.
Leave a Reply